Weekly updatesApr 07, 2026
Weekly Market Outlook | Mar 30 - Apr 5, 2026
Edge Capital's weekly assessment of geopolitical risk, capital flows, protocol developments, and market structure across digital assets

Edge Capital
3 August 2026
| Reference price | $63.64 | Market cap (circulating) | $14.2bn |
|---|---|---|---|
| Revenue (annualised) | ~$1.0bn | Net income (annualised) | ~$810mn |
| EBITDA | $815mn | EBITDA margin (of gross) | 82% |
| P/E circulating (2026E/2027E) | 18x / 17x | P/E fully diluted (2026E/2027E) | 75x / 61x |
| 12-month base case | $83 | Versus reference price | +30% |
Source: Edge Capital Research; CoinGecko, DefiLlama, Token Terminal (Data as of 19 July 2026).
In our view, HYPE is worth $83 a token on a twelve-month outlook, roughly 30% above spot. While that plays out, the daily buyback works in the holder’s favour, returning almost all the profit and thereby reducing the supply. Over five years, a growing float limits how much that payout can compound per token, and on fully diluted supply the token is overvalued today.
The business is exceptional and is not the debate. Hyperliquid runs a derivatives exchange for perpetual futures, the crypto equivalent of the leveraged futures traded on the CME, contracts that let traders take leveraged positions on an asset's price with no expiry date, and eleven employees generate over $1 billion of revenue a year from it, more than $90 million each against roughly $2.4 million at Apple and $3.6 million at Nvidia. It has taken no venture capital, it converts almost all that revenue into profit, and what decides the outcome from here is the share count.
| $mn unless stated | 2025 | H1 2026 | 2026E | 2027E | 2028E |
|---|---|---|---|---|---|
| Gross revenue | 800 | 500 | 1,000 | 1,200 | 1,450 |
| Net revenue | 660 | 410 | 820 | 990 | 1,190 |
| EBITDA | 655 | 408 | 815 | 985 | 1,180 |
| Reserve interest (AQAv2) | 0 | 0 | 13 | 150 | 171 |
| Net income | 650 | 405 | 828 | 1,135 | 1,351 |
| EBITDA margin, % of gross | 82% | 82% | 82% | 82% | 81% |
| Distributions (buyback + burn) | 650 | 405 | 828 | 1,135 | 1,351 |
| Circulating supply, period end (mn) | 209 | 222 | 232 | 256 | 282 |
| Fully diluted supply (mn) | 963 | 958 | 953 | 945 | 936 |
| Earnings per token, circulating ($) | 3.11 | 3.65 | 3.57 | 4.43 | 4.79 |
| Earnings per token, fully diluted ($) | 0.68 | 0.85 | 0.87 | 1.20 | 1.44 |
| P/E, circulating (x) | 10 | 12 | 18 | 14 | 13 |
| P/E, fully diluted (x) | 44 | 52 | 73 | 53 | 44 |
| Distribution yield, % of mcap | 10.4% | 8.3% | 5.6% | 7.0% | 7.5% |
Source: Edge Capital Research; DefiLlama, Token Terminal. Historical multiples use each period's average price; forecasts use the $63.64 reference price, and H1 2026 annualises the half-year. Revenue and cost figures are derived from public on-chain and protocol data and should be treated as indicative rather than precise.
The three revenue lines measure different things, and the gaps between them are not operating costs. Gross revenue is the total fee take. Net revenue deducts the share paid away to builders and to the liquidity vault, about $180 million a year, which is revenue sharing rather than expense. Below net revenue the fee-driven deductions are small, so EBITDA sits just under net revenue. Net income then sits above EBITDA because it adds the reserve-interest line, which carries no builder or vault share and is a balance-sheet return rather than a fee. These are traditional accounting analogies applied to a protocol, not audited accounts.
In our view the token's value follows from its revenue and share count, read against the range comparable businesses trade on. Three lenses do this at different horizons: Lens 1 places today's earnings against peer multiples, Lens 2 derives the multiple a full-payout business deserves, and Lens 3 extends both to a five-year view on each share count. Where they disagree is entirely about how fast locked supply arrives.
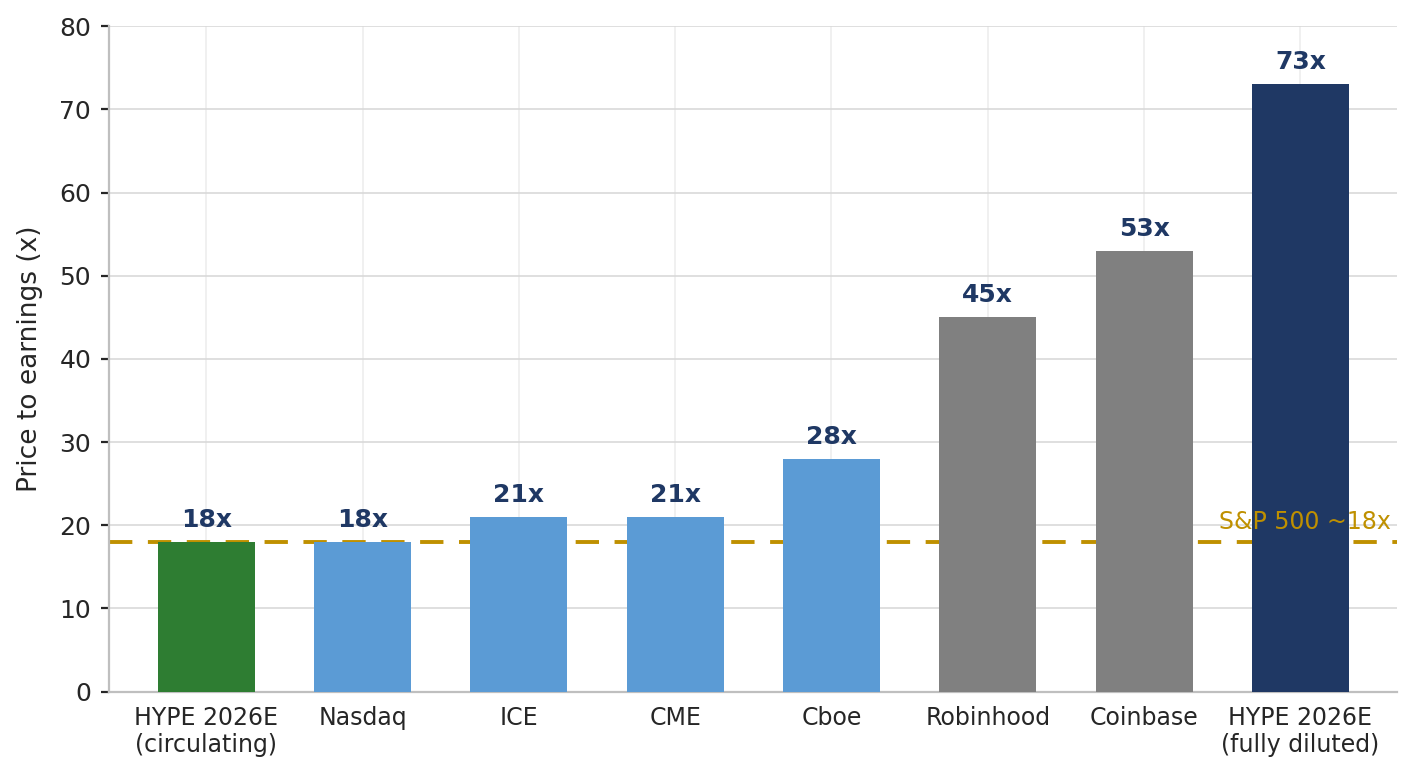
On the convention used throughout this report, calendar-year net income against period-end supply, the token trades at 18 times 2026 earnings and 14 times 2027 on today's float, the fall driven by growing fees and the reserve-interest stream reaching a full year, and at 73 times and 53 times on fully diluted supply. Mature exchanges trade at 18 to 21 times, so on circulating supply HYPE sits at the bottom of that range, and on fully diluted supply it sits with the crypto venues at 45 to 75 times (Chart 1). The dispersion is not about the business but about which share count the buyer believes will be outstanding when the earnings land, which is the question Lens 3 takes up.
Valuation on all three revenue definitions
| Measure | Amount ($mn) | Multiple, circulating | Multiple, fully diluted |
|---|---|---|---|
| Gross revenue | 1,000 | 14x | 61x |
| Net revenue | 820 | 17x | 74x |
| Net income | 828 | 17x | 73x |
Source: Edge Capital Research (Data as of 19 July 2026).
The payout also stands out, though we treat it as a supporting point rather than the basis of the valuation. Because almost all the profit is returned through the buyback, the distribution yield runs at 5.7% of market capitalisation on 2026 estimates, against 1% to 2% at listed exchanges. The yield therefore supports the holding period rather than carrying the valuation case.
Chart 1. HYPE sits at the bottom of the mature exchange range on 2026 earnings and with the crypto venues fully diluted (price to earnings, x)
Source: Edge Capital Research; company filings and market data (Data as of 19 July 2026).
A two-stage payout model returns a justified forward multiple of 19 times. In simple terms, it values the token as the present value of everything it pays out, across two phases: a first phase where payouts grow quickly, then a terminal phase where they settle to a slow rate that continues indefinitely. It is the dividend discount model long used for utilities and tobacco stocks, applied here to buybacks rather than dividends.
We model earnings growing at 14% for five years, fading to a 5% terminal rate, discounted at a 12% cost of equity. That cost of equity is a risk-free rate near 4%, an equity risk premium near 5.5%, and a further 2.5% for crypto, regulatory and key-person risk. The result is stable: moving first-stage growth from 12% to 15% moves the multiple only between 18 and 19 times. The 19 times is therefore a property of the payout structure rather than of an optimistic growth input.
The 14% is grounded in where the revenue comes from. Today the business earns about $1 billion a year, roughly 85% of it from trading fees on perpetual futures. Two forces drive that higher. The first is HIP-3, a permissionless listing venue where anyone can create a new futures market for any asset, whether equities, commodities or indices, which has gone from about 2% of perpetuals volume at the start of 2026 to nearly 50% by mid-year. The second is AQAv2, an arrangement under which about 90% of the interest earned on customer USDC collateral flows back to the protocol, beginning in October 2026. We hold the growth rate below the recent run-rate because both are young and because roughly 85% of revenue still tracks the crypto cycle.
That growth matters to holders because almost none of it is retained. The buyback takes about 99% of net fees automatically, so the profit reaches holders as the revenue grows, and the yield scales with the business rather than with management intent. The trade-off is that with nothing reinvested, growth has to come from the product, such as HIP-3, rather than from capital allocation.
Justified forward multiple, two-stage payout model
| First-stage growth (5yr) | Terminal growth | Cost of equity | Justified multiple |
|---|---|---|---|
| 12% | 5% | 12% | 18x |
| 14% | 5% | 12% | 19x |
| 15% | 6% | 13% | 19x |
Source: Edge Capital Research estimates.
Our twelve-month value is $83 a token, about 30% above spot, within a bear-to-bull range of $30 to $140 (Chart 2). It rests on forward earnings of about $1.1 billion and a float near 248 million tokens as the buyback retires supply, valued on the 19 times the payout model derives.
About $150 million of those earnings is reserve interest, and it is worth isolating. Traders post USDC as collateral, that cash earns interest, and under an agreement with Circle and Coinbase, called AQAv2, about 90% of that interest now returns to the protocol, much as net interest income on client cash is a large earnings line at Schwab and Robinhood. The stream goes live in October 2026 at roughly $150 million a year on about $6 billion of USDC, so it adds a partial period to 2026 and a full year from 2027. Because the balances scale with open interest, the stream rises and falls with the same cycle as fees rather than offsetting it.
Twelve-month base case, by scenario
| Bear | Base | Bull | |
|---|---|---|---|
| Probability | 30% | 45% | 25% |
| Forward net income ($mn) | 650 | 1,082 | 1,450 |
| Justified multiple | 13x | 19x | 23x |
| Forward float (mn) | 285 | 248 | 238 |
| Value per token | $30 | $83 | $140 |
| Versus $63.64 spot | -53% | +30% | +120% |
Source: Edge Capital Research estimates (Data as of 19 July 2026). Probability-weighted value $81.
Chart 2. Twelve-month value across scenarios, against spot (value per token, $)
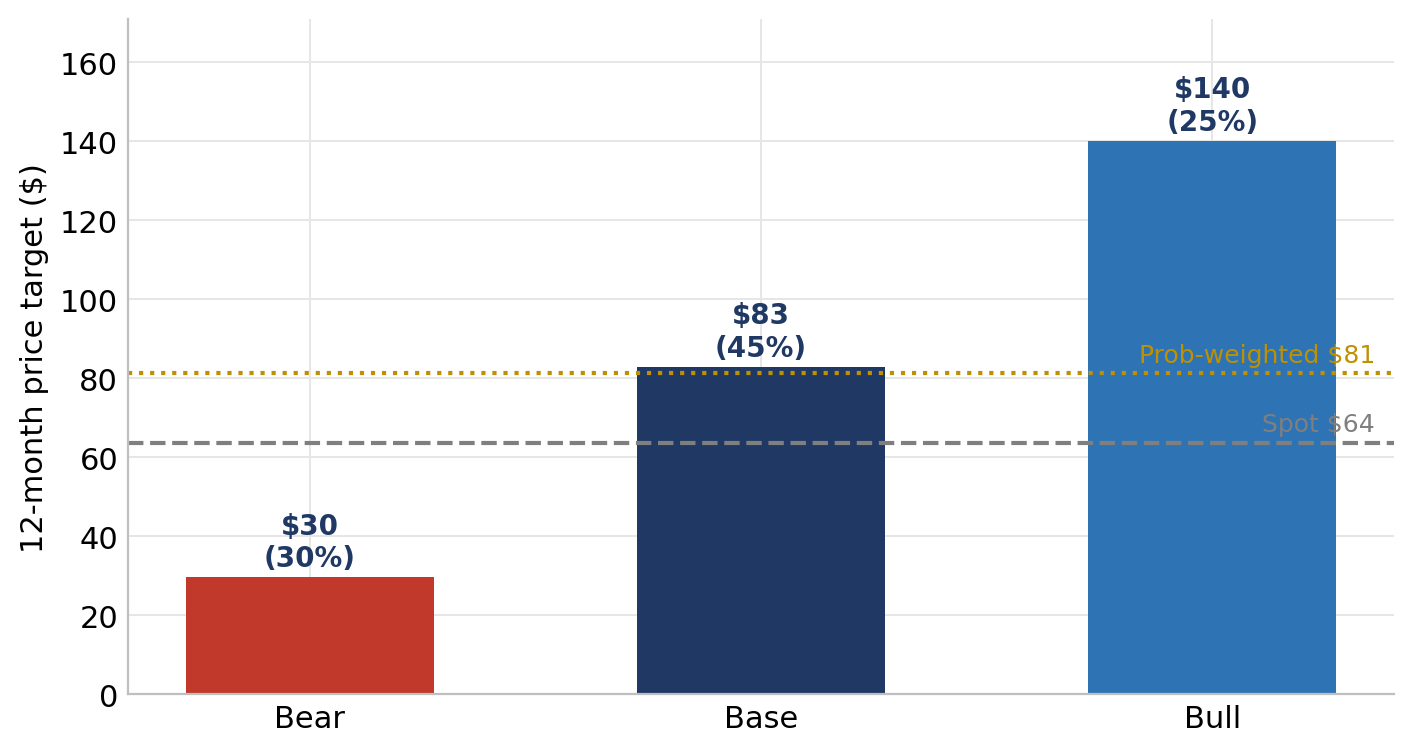
Source: Edge Capital Research estimates (Data as of 19 July 2026). Dashed line is the current price; dotted line the probability-weighted value.
On a five-year view the token compounds at about 5% a year. This is not because the business stalls; earnings roughly double to about $1.6 billion by 2031. It is because the share count keeps rising, dividing that growing profit among more and more tokens. Spread across the tokens trading today, the price is still higher in five years; spread across the total supply, more than twice as many tokens, an investor buying at spot ends up worse off.
Of the two, the value based on today's tradable tokens is the better guide, because the observed data supports it. Net supply is growing near 24 million a year, not the 100 million-plus the raw schedule implies, since staking and burns absorb most of the release. The gap between the two figures is the honest measure of the supply risk, and it is why the position is attractive over twelve months but capped over five. Most of the return comes in the first year, from revenue and a contained float; beyond that, a growing float limits how much the payout can compound per token.
The burn does more than offset dilution; it lowers the ceiling. Because retired tokens leave total supply, the maximum is falling rather than fixed, as the fund destroys close to $2 million of HYPE a day, roughly 12 million tokens a year at the reference price.
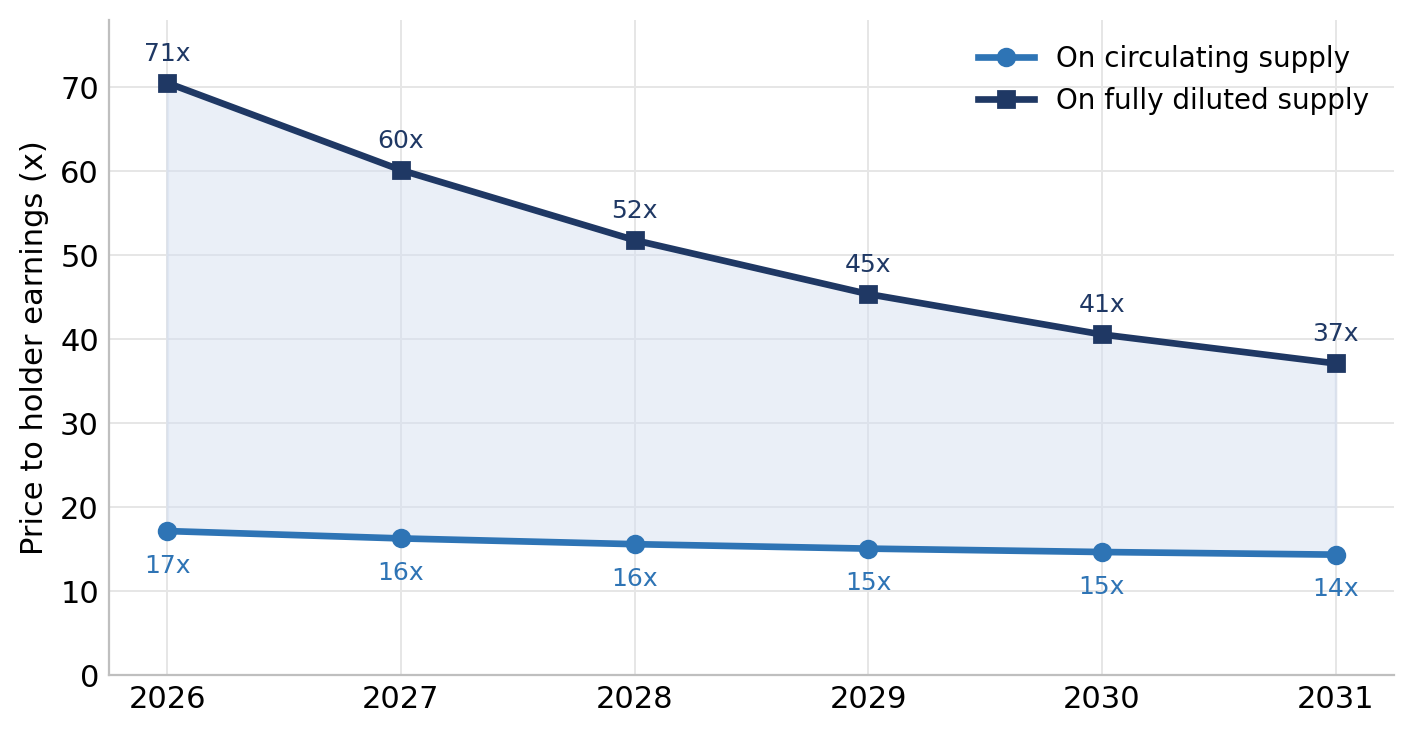
Because the buyback is fixed in dollars rather than in tokens, it retires more supply as the price falls. That makes it a stabiliser rather than a support, and it is why net supply growth has held near a quarter of the schedule across a price range from roughly $30 to $65 (Chart 4).
Chart 3. Circulating supply has grown slowly and remains near a quarter of maximum (circulating supply, mn, and share of 955mn max)
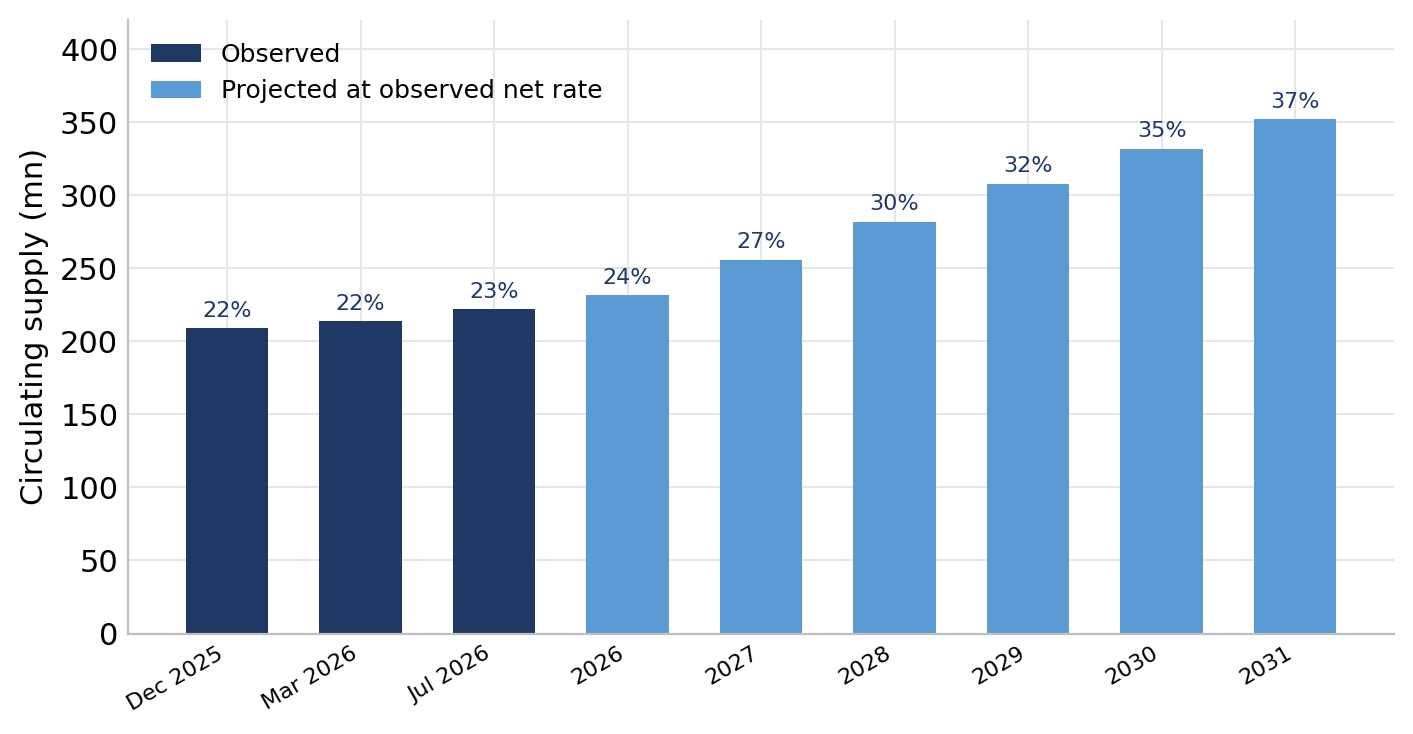
Source: Edge Capital Research; DefiLlama, Tokenomist (Data as of 19 July 2026).
Chart 4. The circulating and fully diluted multiples converge as float rises and burns cut supply (price to earnings, x)
Source: Edge Capital Research; DefiLlama, Token Terminal (Data as of 19 July 2026).
Five-year value, base case
| Circulating basis | Fully diluted basis | |
|---|---|---|
| Year-5 net income ($mn) | 1,560 | 1,560 |
| Exit multiple | 18x | 18x |
| Year-5 supply (mn) | 352 | 865 |
| Value in five years | $80 | $32 |
| Implied annual return from $63.64 spot | 5% | negative |
| Present value at 12% cost of equity | $45 | $18 |
Source: Edge Capital Research estimates (Data as of 19 July 2026).
Fee reflexivity is the risk that matters most, because it moves earnings and the multiple in the same direction. About 85% of fees track trading activity, so a collapse in volatility cuts the payout and compresses the multiple at once, which is how the bear case reaches $30. Whether that exposure counts as crypto beta is a classification question rather than a diversification one, because the HIP-3 equity, commodity and index markets settle on the same chain and draw on the same liquidity. Two consecutive quarters of fees down more than 20% would end the value case.
Supply absorption is the second risk, and it is behavioural rather than structural. Contributors can claim about 10 million tokens a month, and the case depends on them staking rather than selling, since sustained selling pushes the forward float toward 330 million and the base case below spot. We do not view either risk as systemic, because both are measurable on-chain before they reach earnings.
Named mechanisms, and what to watch
| Risk | What actually happens | What to watch |
|---|---|---|
| Fee reflexivity | About 85% of fees track trading activity. A volatility collapse cuts the payout and the multiple together, pushing toward the bear. | Two straight quarters of fees down more than 20%. |
| Supply absorption | Contributors can claim about 10mn tokens a month. If they sell rather than stake, the float grows faster and the target falls. | The monthly claim and on-chain staking behaviour on the sixth of each month. |
| Regulation | No US ruling on builder-deployed stock perpetuals. Enforcement would stall HIP-3, the main growth lever. | Action on equity-perp deployers; CFTC posture after its June recognition of the perp model. |
| Competition | CME lists single-stock futures, Coinbase runs regulated US perpetuals, Binance has entered equity perps, and other venues run their own buybacks. | HYPE share of on-chain perpetuals volume falling below 50%. |
| Concentration | One builder, trade.xyz, runs more than 90% of HIP-3 open interest. Coinbase is both a competitor and a reserve-interest partner. | Builder diversification; activation and terms of the reserve-interest deal. |
| Bridge and collateral | Core collateral is USDC bridged from another chain. A bridge or validator-set compromise is existential. | Stablecoin migration progress; validator count. |
Source: Edge Capital Research (Data as of 19 July 2026).
The upside is the mirror image of the first two rows, and the same two variables drive both tails. If fees compound through an upcycle and contributors keep staking, the float stays contained and the buyback retires more, moving value toward the bull case of $140. Looking out, the main risk is not that the business stalls, but that locked supply reaches the market faster than the buyback can absorb it. The number to watch is the monthly contributor claim on the sixth and how much of it is staked rather than sold, which is visible on-chain within days.
We are constructive on HYPE on a twelve-month view and disciplined about the reason. The franchise is exceptional, the earnings are growing, and the buyback returns almost all of them to holders while the float stays contained. The return comes from that revenue and that share count, and the price we reach sits below where comparable businesses trade. The principal risk is reflexivity in fees, and the supply schedule is a real but observable second-order concern. The constraint is the monthly unlock data, and we would revisit the work if fee momentum or contributor staking behaviour turns.
Assumptions, stated. Every input is a choice, and the material ones are sensitised.
The two swing variables, at base forward earnings of $1,082mn. The float only pushes the value below spot above roughly 330mn, which requires contributors to start selling most of what vests.
| float 230 | float 248 | float 285 | float 330 | |
|---|---|---|---|---|
| 15x multiple | $71 | $65 | $57 | $49 |
| 17x multiple | $80 | $74 | $65 | $56 |
| 19x multiple (base) | $89 | $83 | $72 | $62 |
| 21x multiple | $99 | $92 | $80 | $69 |
| 23x multiple | $108 | $100 | $87 | $75 |
Source: Edge Capital Research estimates.
| Circulating-basis PV | 10% CAGR | 14% CAGR | 18% CAGR |
|---|---|---|---|
| Discount 10% | $41 | $50 | $60 |
| Discount 12% (base) | $38 | $45 | $54 |
| Discount 14% | $34 | $41 | $49 |
Source: Edge Capital Research estimates.
CONFIDENTIAL: Not for Further Distribution. This document is for potential clients or partners only. Only qualified investors are permitted to read this document. These are research views for informational purposes only and are not an advertisement, an offer, invitation or a solicitation to buy or sell securities or investment products, an official confirmation of any kind and is not intended as investment advice or recommendation.
This document is for discussion purposes only and is intended as a preliminary summary of the purpose and principal business of Edge Capital Investment Management Ltd ("Edge Capital" or the "Investment Manager") and its private investment fund (the "Fund"). This document does not purport to be complete and is qualified in its entirety by reference to the more detailed discussions to be contained in the Fund's offering documentation. The Investment Manager has the ability in its sole discretion to change all or any part of the strategy and parameters described herein without notice.
This document is being provided to you on a confidential basis solely to assist you in deciding whether or not to proceed with a further investigation of the Investment Manager and the Fund. Accordingly, this document may not be reproduced in whole or part and may not be delivered to any person without the consent of the Investment Manager.
Nothing set forth herein shall constitute an offer to sell any securities or constitute a solicitation of an offer to purchase any securities. Any such offer to sell or solicitation of an offer to purchase shall be made only by formal offering documentation, which will include, among other things, a confidential offering memorandum, a limited partnership agreement and a subscription agreement. Such formal offering documentation will contain additional information not set forth in this document (including, among other things, certain risks of investing in the Fund), which will be material to any decision to invest in the Fund.
No information is warranted by the Investment Manager or its affiliates or principals as to completeness or accuracy, express or implied, and is subject to change without notice. This document contains forward-looking statements, including observations about markets and industry and regulatory trends as of the original date of this document. Forward-looking statements may be identified by, among other things, the use of words such as "expects," "anticipates," "believes," or "estimates," or the negatives of these terms, and similar expressions. Forward-looking statements reflect the Investment Manager's views as of such date with respect to possible future events. Actual results could differ materially from those in the forward-looking statements as a result of factors beyond the Investment Manager's control. You are cautioned not to place undue reliance on such statements. There is no obligation on the part of the Investment Manager to update any of the forward-looking statements in this document.
This document should only be considered current as of the date of publication without regard to the date on which you may receive or access the information. The Investment Manager maintains the right to delete or modify information without prior notice. Charts, tables and graphs contained in this document are for illustrative purposes only and are not intended to be used to assist you in determining which securities to buy or sell or when to buy or sell securities. Statements made herein that are not attributed to a third-party source reflect the views and opinions of the Investment Manager.
Speculative and risky investment: Investing in newer and smaller asset classes such as cryptocurrencies is speculative, risky and unsuitable for some investors even when representing only a portion of a broader investment program. Some of the specific risks to which an investment in the cryptocurrency sector may be subject to include without limitation: High levels of volatility; Illiquidity; Uncertain valuations; Dynamics which may be adverse to the investment, including broad market movement, instrument specific factors, sector-specific factors, and geography-specific factors; Investments may be based on flawed, incomplete or misunderstood premises; Investments may be mistimed or otherwise ineffectively executed; Exchanges and wallets may close, become regulated, be hacked, etc.; Over the counter trading and counterparty risks; limited and rapidly changing regulations; Potential illegality of various assets and activities; Conflicts of interest and fraud; Litigation; Operational challenges and risks, including underdeveloped and untested asset custody practices; Limitations in market infrastructure, which is developing and incomplete; Transfers of cryptocurrency assets generally irrevocable; Lost or stolen private keys, malware, hacks, other cyberattacks; Blockchain protocol amendments (malicious or otherwise); Startup and untested technologies and companies, technology and market changes, redundancy and obsolescence risks. These materials presume that the reader is an experienced and sophisticated investor who is willing to bear substantial risks and losses.
© Copyright 2026 Edge Capital Investment Management Ltd (and its affiliated entities), ALL RIGHTS RESERVED. No part of this publication may be reproduced, stored in a retrieval system, or transmitted, in any form or by any means, electronic, mechanical, photocopying, recording, or otherwise, without the prior written permission of Edge Capital Management Ltd. or its affiliated entities.